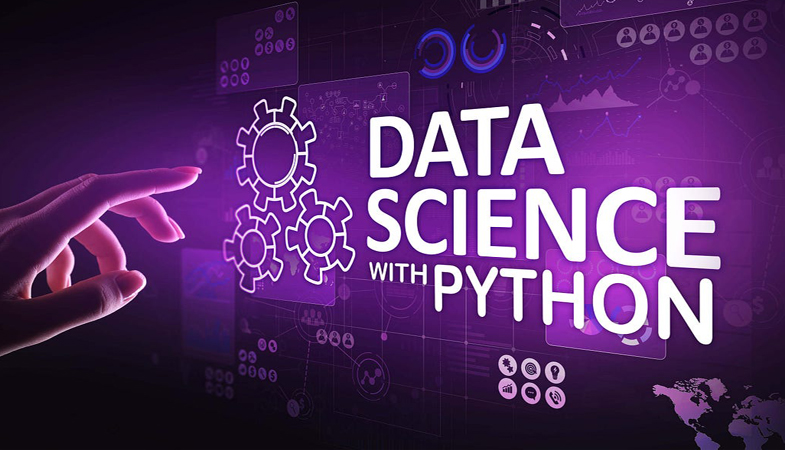
Data Science (DA) is the process of examining data sets in order to draw conclusions about the information they contain, increasingly with the aid of specialized systems and software. Analysis of data is a process of inspecting, cleaning, transforming, and modelling data with the goal of discovering useful information, suggesting conclusions, and supporting decision-making.
Data Science (DA) is the process of examining data sets in order to draw conclusions about the information they contain, increasingly with the aid of specialized systems and software.
Data Science (DA) is the process of examining data sets in order to draw conclusions about the information they contain, increasingly with the aid of specialized systems and software. Analysis of data is a process of inspecting, cleaning, transforming, and modelling data with the goal of discovering useful information, suggesting conclusions, and supporting decision-making.
At TechIn IT, we proudly assure that every Trainee who successfully completes our program will be awarded a certificate. We are officially associated with APSCHE, AICTE, MSME, Skill India, IAF, and NASSCOM. The certification will reflect the Trainees dedication and skill development, recognized under national-level standards .
AI vs ML vs DL vs Data Science
Data Science Scope, ApplicationsData Science Introduction
Predictive v/s Descriptive Data Analysis
Data Science v/s Data Analytics
Regression & Classification Problems
What makes a Data Science Expert?
The art of making stories from Data
Use Cases and Case Studies
Introduction to Python Programming
What is Python?
Installing Anaconda
Understanding the Spyder Integrated Development Environment (IDE)
Python basics and string manipulation
lists, tuples, dictionaries, variables
Control Structure – If loop, For loop and while Loop
Single line loops
Writing user defined functions
Object oriented programming
Working with Class&Inheritance
Statistic for Data
Measure of Central Tendency – Mean, Mode and Median
Grouped and Ungrouped Data
Measure of Spread – IQR, Variance and Standard Deviation
Covariance
Correlation
Kurtosis, Skewness
Analyzing the categorical Data
Proportional Test
Chi Square Test
Fisher’s Exact Test
Mantel Henszel test
Analyzing the Continuous Data
One Sample T-Test
Two Independent Samples Tests
Paired T-test
Wilcoxon Test
Anova
Kruskal Wallis Test
Probabilistic Theory
Events and their Probabilities
Rules of Probability
Conditional Probability and Independence
Distribution of a Random Variable
Bayes Theorem
Moment Generating functions Central
Limit Theorem
Expectation & Variance
Standard Distributions – Bernoulli, Binomial & Multinomial
Intro to Numpy Arrays
Creating ndarraysIndexing
Data Processing using Arrays
Mathematical computing basics
Basic statistics
File Input and Output
Getting Started with Pandas
Data Acquisition (Import & Export)
Indexing
Selection and Filtering
Sorting & Summarizing
Descriptive Statistics
Combining and Merging Data Frames
Removing Duplicates
Discretization and Binning
String Manipulation
Visualization in python, case studies
Introduction to Visualization
Visualization Importance
Visualization Rules
Working with Python visualization libraries
Matplotlib
Creating Line Plots, Bar Charts, Pie Charts, Histograms, Scatter Plots
Working with Seaborn
Data Visualization using Seaborn
Basic Plots, color palettes
Plotting categorical data
Visualizing linear relationship
Plotting on data-aware grids
HeatMap, Histogram, Barplot, Factor plot
Density Plot, Joint Distribution Plot
Linear Regression
Regression Problem Analysis
Mathematical modelling of Regression Model
Gradient Descent Algorithm
Programming Process Flow
Use cases
Regression Table
Heteroscedasticity
Model Specification
L1 & L2 Regularization
Linear Regression – Case Study & Project
Programming Using python
Building simple Univariate Linear Regression Model
Multivariate Regression Model
Apply Data Transformations
Identify Multicollinearity in Data Treatment on Data
Identify Heteroscedasticity
Modelling of Data
Variable Significance Identification
Model Significance Test
Bifurcate Data into Training / Testing Data set
Build Model on Training Data Set
Predict using Testing Data Set
Validate the Model Performance
Project 1: Boston Housing Prizes Prediction
Project 2: Cancer Detection Predictive Analysis
Best Fit Line and Linear Regression
Log Odds and Interpretation
Regression Table
Null Vs Residual Deviance
Problem Analysis
Cost Function Formation
Mathematical Modelling
Use Cases
Case Study & Project
Model Parameter Significance Evaluation
Drawing the ROC Curve
Estimating the Classification Model Hit Ratio
Isolating the Classifier for Optimum Results
Project 3: Digit Recognition using Logistic Regression
Decision Trees with Case Study
Forming a Decision Tree
Components of Decision Tree
Mathematics of Decision Tree
Decision Tree Evaluation
Practical Examples & Case Study
Project 4: Intrusion Detection
Random Forests
Random Forest Mathematics
Examples & use cases using Random Forests
K-NN Algorithm – Applications & Case Studies
Understanding the KNN
Distance metrics
Case Study on KNN
Support Vector Machine
Concept and Working Principle
Mathematical Modelling
Optimization Function Formation
The Kernel Method and Nonlinear Hyperplanes
Use Cases
Programming SVM using Python
Project 5- Character recognition using SVM
Project 6- Regression problem using SVM
Project 7- Wisconsin Cancer Detection using SVM
Clustering
Hierarchical Clustering
K Means Clustering
Use Cases for K Means Clustering
Programming for K Means using Python
Image Color Quantization using K Means Clustering Technique
Cluster Size Optimization vs Definition Optimization
Projects & Case Studies
Principle Component Analysi
Dimensionality Reduction, Data Compression
Curse of dimensionality
Multicollinearity
Factor Analysis
Concept and Mathematical modelling
Use Cases
Programming using Python